This is so simple, I can’t believe I haven’t found anything written about it anywhere else on the internet.
Arduino is a fantastic ecosystem for simplifying embedded development. But that simplicity comes at a cost, which is it makes it much more difficult to deal with lower level issues.
The Portenta runs Arduino sketches on top of a real time OS called Mbed. If there are crashes happening at the OS or HAL level, you will probably need to go beyond simple println() debugging, especially is the problem takes down the emulated USB serial port before information can be reported.
- Catching and decoding crash dumps
- Onboard line-by-line debugging with MRI
Catching and decoding crash dumps #
If your Portenta is experiencing a crash (hard fault) the easiest thing you can do is catch the crash info read out over one of the serial UARTs. Then we can use Mbed’s crash_log_parser.py to decode the output and pinpoint exactly where and how the crash happened.
First you will need to configure PlatformIO to generate a build with debugging symbols, and a .map file.
; platformio.ini

[env:portenta-debug]
build_type = debug
build_flags =
	-D CORE_DEBUG_LEVEL=5
	-D CORE_DEBUG_LEVEL_WIFI=5
	-D CORE_DEBUG_LEVEL_MQTT=5
	-Wl,-Map,firmware.map
I also included the -D CORE_DEBUG_LEVEL... defines, which enable verbose output from the Arduino core.
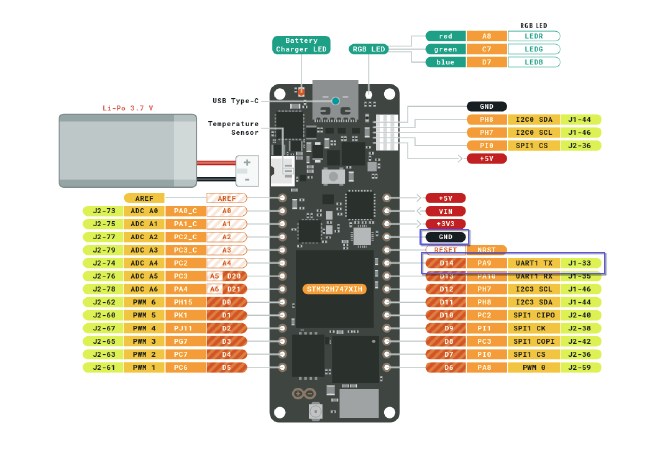
Unfortunately Mbed will not output crash dumps over the Portenta’s USB CDC connection. This means you will have to connect a second serial UART cable. I use this handy multi-protocol serial cable from Adafruit. Only two pins need to be connected. Connect GND to any ground pin and connect the RX pin on the cable to the UART1 TX pin on the portenta.
It may also be handy to use the Portenta Breakout board.
Next your program will have to redirect Mbed’s stdout stream to UART1. Also remember to initialize the serial port.
// main.cpp

REDIRECT_STDOUT_TO(Serial1)   // Use UART 1 for printing Mbed OS errors

void setup() {
  Serial1.begin(115200);
}
Now flash your program and monitor the serial output with the tool of your choice. The
Serial Monitor Extension for VSCode works well. Otherwise you can use picocom in a terminal.
picocom -b 115200 /dev/ttyUSB0
When the crash happens, you will get output similar to the following. Copy and paste this into a file we’ll call crash.txt
++ MbedOS Fault Handler ++

FaultType: HardFault

Context:
R0   : 0000AAA3
R1   : 20002070
R2   : 00009558
R3   : 00412A02
R4   : E000ED14
R5   : 00000000
R6   : 00000000
R7   : 00000000
R8   : 00000000
R9   : 00000000
R10  : 00000000
R11  : 00000000
R12  : 0000BCE5
SP   : 20002070
LR   : 00009E75
PC   : 00009512
xPSR : 01000000
PSP  : 20002008
MSP  : 2002FFD8
CPUID: 410FC241
HFSR : 40000000
MMFSR: 00000000
BFSR : 00000000
UFSR : 00000100
DFSR : 00000008
AFSR : 00000000
SHCSR: 00000000

Thread Info:
Current:
State: 00000002 EntryFn: 0000ADF5 Stack Size: 00001000 Mem: 20001070 SP: 20002030
Next:
State: 00000002 EntryFn: 0000ADF5 Stack Size: 00001000 Mem: 20001070 SP: 20002030
Wait Threads:
State: 00000083 EntryFn: 0000AA1D Stack Size: 00000300 Mem: 20000548 SP: 200007D8
Delay Threads:
Idle Thread:
State: 00000001 EntryFn: 00009F59 Stack Size: 00000200 Mem: 20000348 SP: 20000508

-- MbedOS Fault Handler --
Now we can decode the crash log using
Mbed's crash_log_parser.py. Download this python script and place it in the root directory of your PlatformIO project. The script depends on the gcc ARM compiler. You may need to install arm-none-eabi-binutils from your distro, or point the script to the executable provided with Platformio. For example…
# crash_log_parser.py

#arm-none-eabi-nm -nl <elf file>
#_NM_EXEC = "arm-none-eabi-nm"
_NM_EXEC = "~/.platformio/packages/toolchain-gccarmnoneeabi/bin/arm-none-eabi-nm"
Run the script with the following command
python crash_log_parser.py crash.txt .pio/build/portenta-debug/firmware.elf firmware.map
You should get output similar to this
Parsed Crash Info:
        Crash location = zero_div_test() [0000693E]
        Caller location = $Super$$main [00009E99]
        Stack Pointer at the time of crash = [20001CC0]
        Target/Fault Info:
                Processor Arch: ARM-V7M or above
                Processor Variant: C24
                Forced exception, a fault with configurable priority has been escalated to HardFault
                Divide by zero error has occurred

Done parsing...
Onboard line-by-line debugging with MRI #
If you consult the PlatformIO docs, you will see a list of hardware debugging devices that can be used. Thankfully, there is an easier solution that requires no additional hardware. Arduino provides a library for using MRI (Monitor for Remote Inspection) which is an on-device GDB compatible debug server. The Arduino library for using MRI is called ThreadDebug. Arduino's intended method of connecting to MRI is using the proprietary Trace32 debugging software. Although Arduino kindly provides licenses for this software, we can also directly connect the PlatformIO IDE and use it’s own debugging features.
Add this code to your program. This…
- Includes the lib
- Instantiates the debugger
- Redirects the serial output
// main.cpp

/* This example demonstrates how to include the ThreadMRI library which allows debugging of the Portenta H7 and Nano 33 BLE [Sense]
   with GDB via a serial interface.

   To connect to the target, launch gdb with the following parameters

   arm-none-eabi-gdb -ex "set pagination off" --baud {230400} -ex "set target-charset ASCII" -ex "target remote {debug.port}" {project_name}.elf

   The baud rate needs to match the one provided in UartDebugCommInterface constructor, while {debug.port} depends on the operating system (eg. /dev/ttyUSB0 or COM15).

   If UsbDebugCommInterface is being used you can specify any baudrate.
*/

#include <ThreadDebug.h>

//UartDebugCommInterface debugComm(SERIAL1_TX, SERIAL1_RX, 230400);
//ThreadDebug            threadDebug(&debugComm, DEBUG_BREAK_IN_SETUP);

UsbDebugCommInterface  debugComm(&SerialUSB);
ThreadDebug            threadDebug(&debugComm, DEBUG_BREAK_IN_SETUP);

// Redirect Serial.print*() output to GDB instead of SerialUSB where it would conflict with ThreadDebug.
// NOTE: Calls to Serial.print*() will block waiting for GDB to be connected so only useful to use this redefine
//       when actively debugging the program.
#undef Serial
#define Serial DebugSerial

void setup() {

}
Add a new target to you platformio.ini file. This will generate a build with debug symbols, and have PlatformIO connect directly to the debug server on the device.
; platformio.ini

[env:portenta-debug]
build_type = debug
build_flags = -DCORE_DEBUG_LEVEL=5
debug_tool = custom
debug_init_cmds =
	set pagination off
	set target-charset ASCII
	target remote $DEBUG_PORT
debug_port = <portenta board serial port>
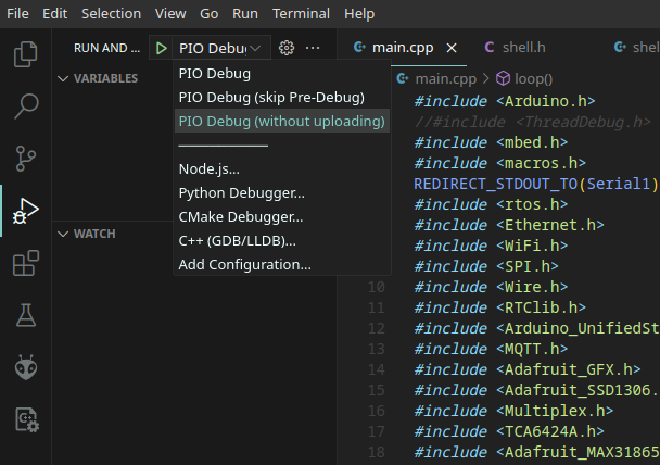
After this you can flash your program. Then in the debugging panel choose “PIO Debug (without uploading)”. The next time you flash the Portenta you may need to boot into the bootloader first by double clicking the reset button.